
William Broughton
As an Analytics professional, I interpret and visualize data to present clear and actionable insights. Follow my journey and check out some of my work belowExcel | Tableau | SQL | Alteryx
Projects
SQL Project: Using SQL to build Relational Database for NBA Players
Query #1: Create Table

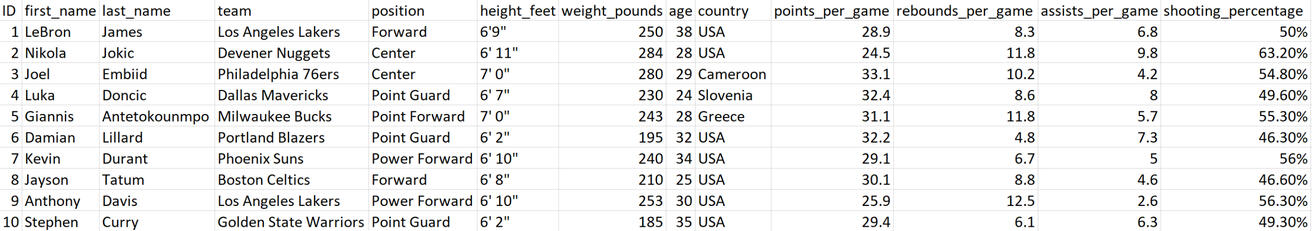
Query #2: View Players

Below is a list of some of the best current NBA players, from the above query:
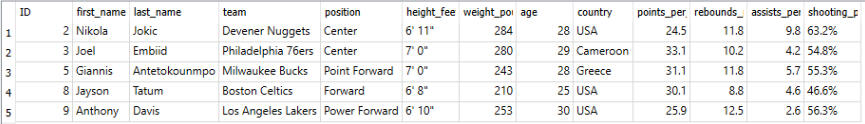
Query #3: View Players Age(s)
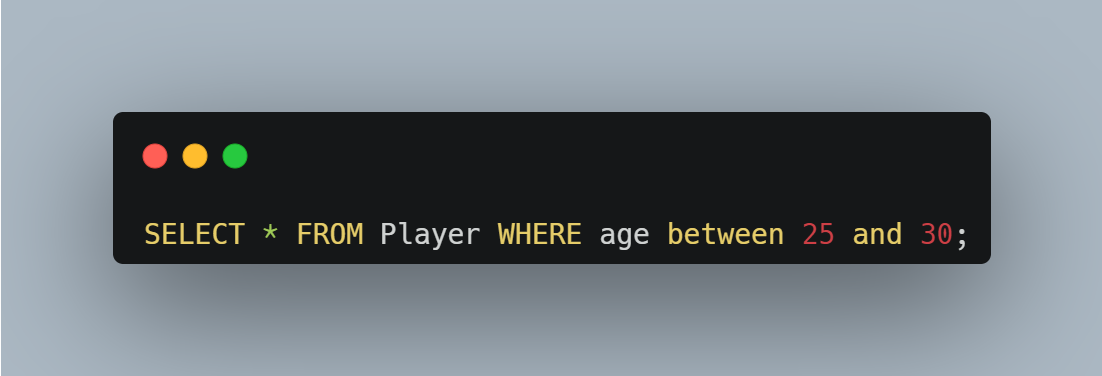
Out of the list of 10 NBA players, 50% of them are between the ages of 25 and 30:
Query #4: Highest Rebounds per Game
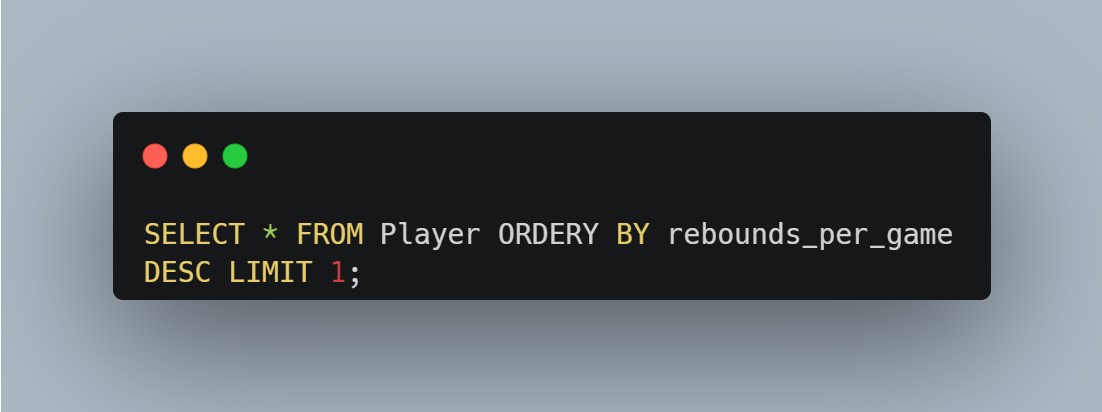
Anthony Davis had the most rebounds per game in the NBA:

The data was made from the following resources:
- NBA Data - https://www.nba.com/player
- SQL Analysis: SQLiteStudio
Tableau Project: Create a Stocks Return Heatmap
In this visual, we utilize Google Finance to extract 11 stocks between the NASDAQ & NYSE, in order to build a heatmap.
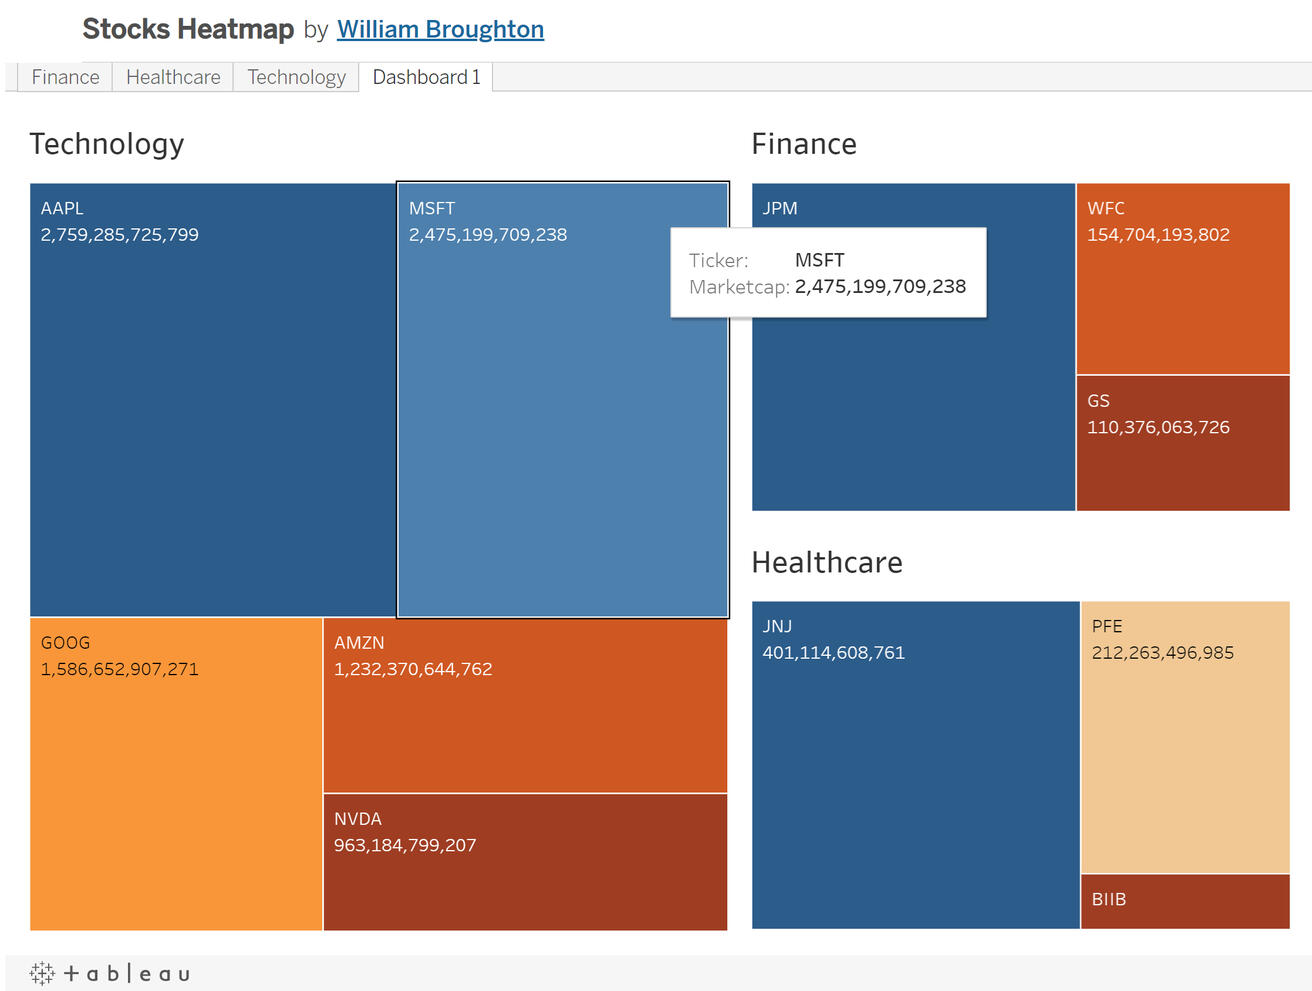
Exploring companies listed on the NASDAQ and NYSE, I chose 11 stocks between different sectors as of May 29, 2023 in order to analyze market cap data.
The functions/resources that were used:
Yahoo Finance
TEXT Function
TODAY() Function
To view the full visual, please clink the link below: